Optimizing startup of web app
Recently I read an article on HN on how to Get 100/100 Google Page Speed Score,
and wondered how high score I can get with my online text editor/IDE ...
The editor is a web app with lots of JavaScript, so it's quite heavy compared to normal web sites.
What I started out with
A test run of webide.se gave me a Google PageSpeed Insights score of 33 / 100 for mobile and 40 / 100 for desktop, and the overall rating of, quote: "Poor".
Google uses page speed to sort search results, so improving the score would be good for Search Engine Optimization (SEO).
Lets fire up Chromium dev tools and the Performance tab to see what's going on ...
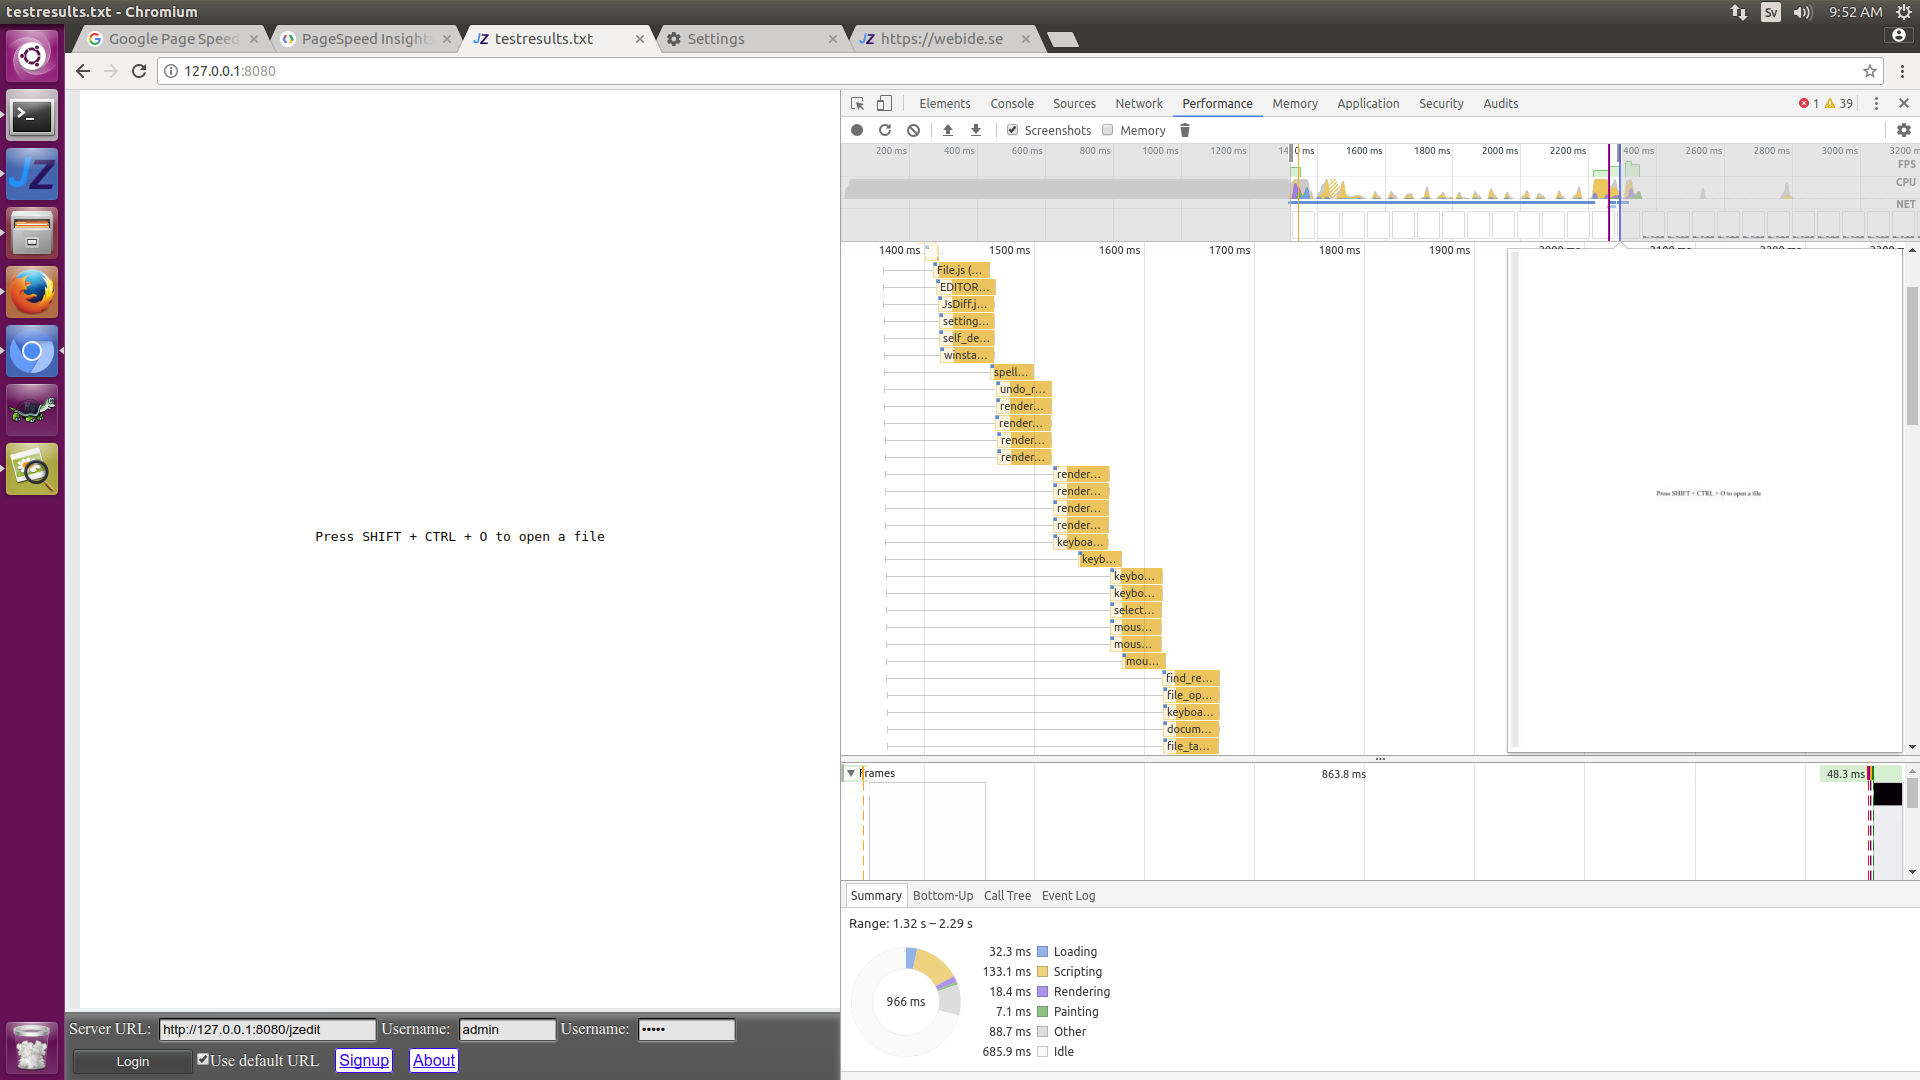
That's around 1000ms (one second) to load the app, which isn't bad, but it's idle for ca 700ms, and we can probably do something about that.
If you look at the waterfall we can see that the browser loads six files at a time, as the editor has a lot of JS files, that's a lot of time wasted.
I also tested it in production where HTTP2 is enabled, but it still looks like the waterfall, although smoother.
Let's inline ALL 102 JavaScript files into index.htm and see if we can get rid of the idle time (which is probably caused by network latency) ...
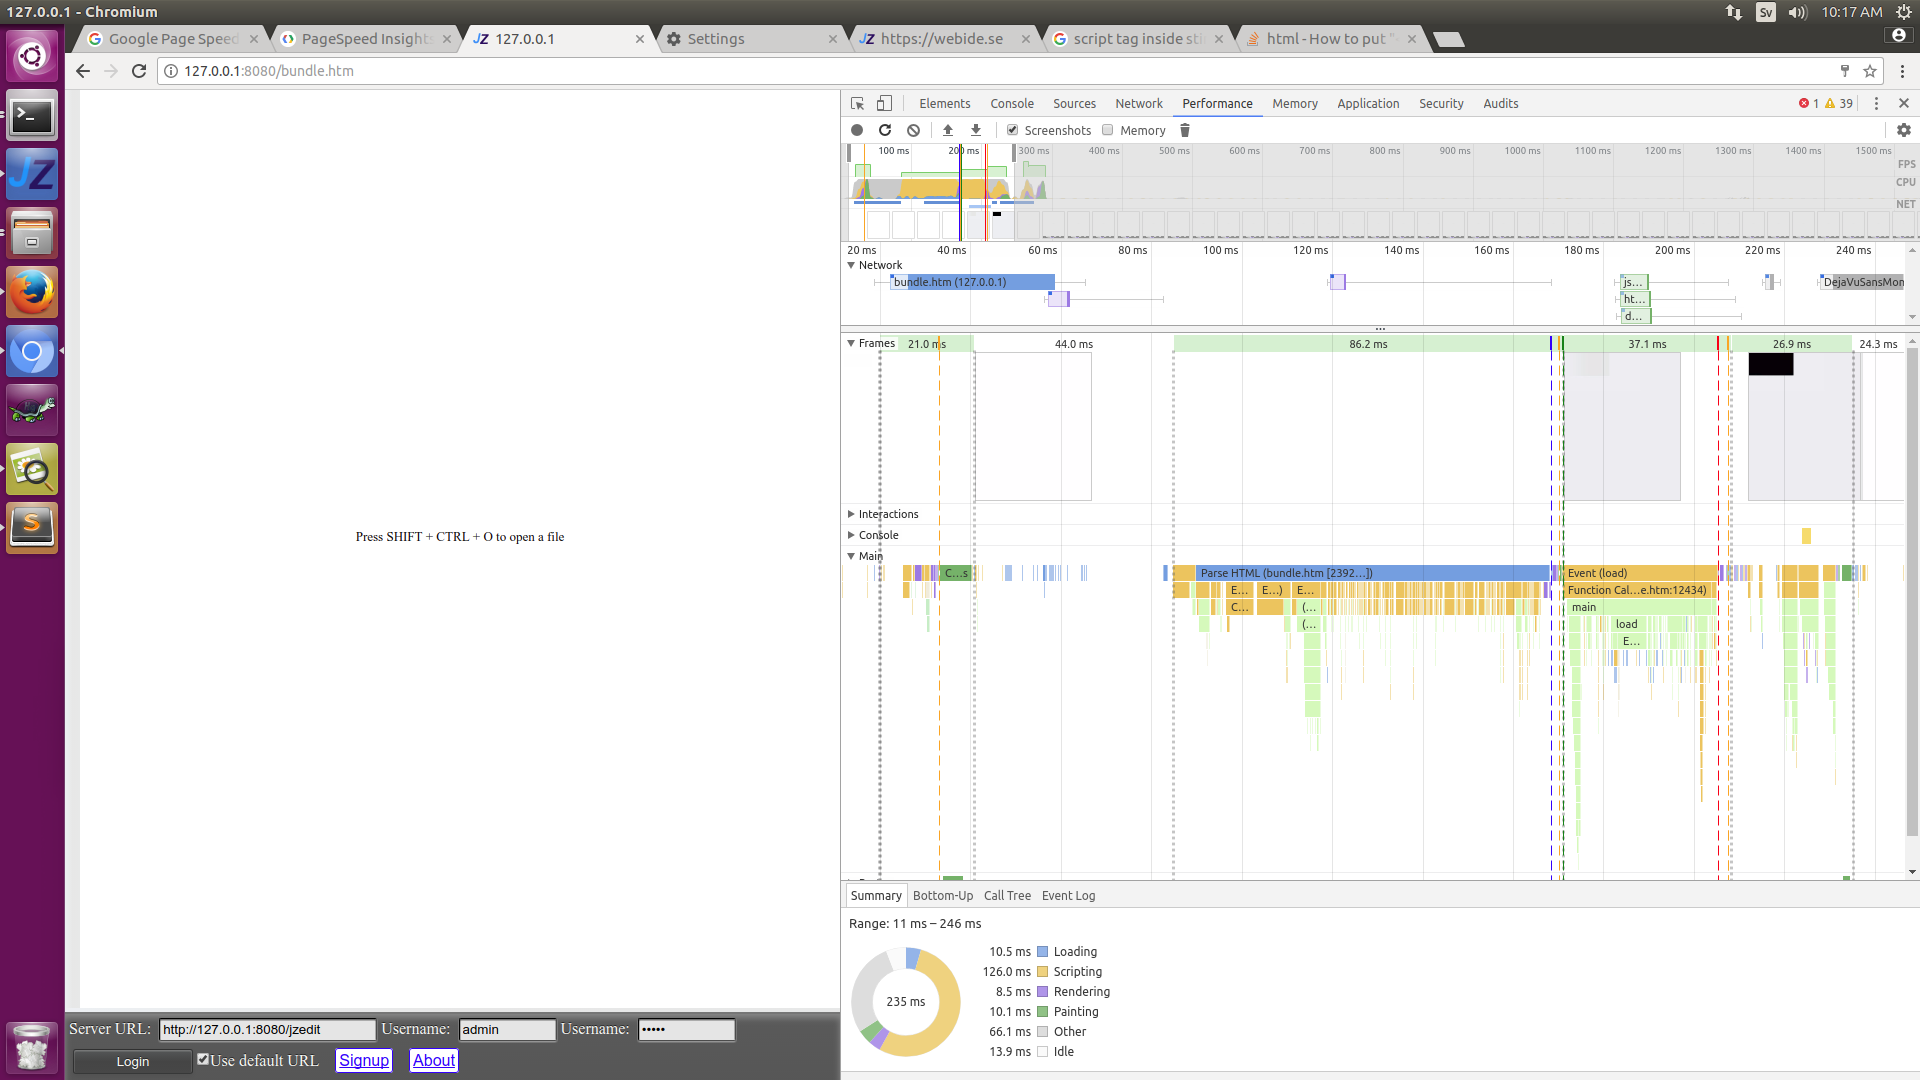
The idle time has now gone from 700ms to 10ms and the total load time from 1000ms to around 230ms!
Lets see what PageSpeed Insights say now when we've made it 3 times faster:
65 / 100 (+32) on mobile and 79 / 100 (+39) on Desktop, with the overall rating of, quote: "Needs Work" ...
This is what PageSpeed Insights suggests I should do:
- Prioritize visible content
- Minify HTML
- Eliminate render-blocking JavaScript and CSS in above-the-fold content
- Enable compression
- Minify CSS
It already beleaves the JavaScript is minified because the first of the 102 scripts is minified, while the rest is not.
Lets see what happens with the load time if we do minify all of the JavaScript's ...
There's some gotchas when inlining JavaScript though, as the HTML parser will have trouble with ending script tags inside JavaScript strings. But I got it to work by raplacing all ending script tags with <\\/script> and the old trick of putting everything inside HTML comments.
This is the Nodejs script I use to make the bundle:
After minifying JavaScript
The size of the bundle.htm went from 1,282,258 bytes (298,089 gzip) to 546,232 bytes (147,959 gzip) but the actual load time went up from 230ms to 260ms and idle time to 50ms. So by minifying all JavaScript the loading time increased slightly, I did not expected that!
When it comes to optimizations - do not take things for granted!
Never do premature optimizations. Always measure the result of the optimization!
Lets see what PageSpeed Insights think of our minified JavaScript:
74 / 100 (+9) on mobile and 89 / 100 (+14) on Desktop. It gave us an reward for the lowering the file size!
That tiny CSS file is still slowing us down though, as the app needs to wait for it to render.
Inlining CSS requires some extra work as we have to change all the relative paths ... What else can we do ?
There's a JavaScript file that dynamically loads a font. Lets see if not loading the font will improve things:
Loading time went from 230 to ca 200ms! Around 10ms idle time (with JavaScript's minified). 74 / 100 on mobile and 89 / 100 on desktop, so no improvement on PageSpeed Insights score from skipping the fonts!
There's also a JavaScript that loads three icons that are never displayed, lets see if not loading those have any effect ...
Idle time and total load time went up ca 40ms, not as expected.
Inline the CSS
I made this Nodejs script to do the inlining, same as above, but also inlines CSS. It doesn't minify the CSS or HTML, but there's modules for that, so it shouln't be that difficult to add.
After inlining both JavaScript, minifying the JavaScript, and inlinging the CSS:
The loading time went down to just 160ms with almost no idle time.
The bundle now contains everything and there's just one http request.
PageSpeed Insights gives a 80 / 100 (+6) score on mobile and 93 / 100 (+4) on Desktop.
Gzip compression
We are still not doing compression though. And the CSS and HTML is not compressed. Lets gzip the bundle and have the nodejs server serve that instead ...
Gzip compression did nothing for load time, lets see what PageSpeed Insights thinks ... 75 / 100 (-5) on mobile 91 / 100 (-2) on desktop. That's actually lower! What's going on !?
When requesting index.htm we have ca 80ms connection time, 40ms SSL handshake, 40ms waiting (TTFB). With the gzip there's 80ms wait (TTFB) ...
The nodejs server script is infront of a nginx proxy, so lets bypass that and have nodejs listen on port 80 (no SSL) ... That gives 74 / 100 on mobile and 90 / 100 on Desktop. Even worse!
So I made Nginx serve it instead, so when an request is made to / (root/index) Nginx serves the bundle instead of proxying to the nodejs server.
Here's the Nginx config snippet. (Placed inside a server snippet):
When Nginx handles the request we are back with 80 / 100 and 93 / 100 PageSpeed score, and we are serving over HTTPS! The connection and wait time (TTFB) is not better though, either Google PageSpeed insight favor Nginx, or it gives us a bonus for using HTTPS !?
Pagespeed still say:
- Prioritize visible content
- Enable compression
Lets make sure everything gets gziped via nginx:
That did not help pagespeed score though.
Disable stuff we don't need
... We are still serving the test suite with the app, while it's nice to be able to run the tests in production, it's not needed.
Removing the tests from the bundle lowered the startup's scripting time from 140ms to 100ms.
This did suprisningly have a slight negative impact on pagespeed score: 79 (-1) on mobile and 93 (-+0) on desktop.
... We are loading a websocket connection that tries to login to the server, and when that fails it shows a login screen. The wesocket connection is made when the app has finished loading. Can we make the connection earlier ?
Lets cheat a little bit:
Google page speed insight now gives 100 / 100 for mobile, and 100 / 100 on desktop!
Lets enable the custom font: Didn't affect the score! - Probably because most browsers default behaviour is to wait to load the font until it's needed.
Conclusion
Now when we have disabled the automatic websocket connection for Speed Insights, lets see what score we get without any optimizations:
43 on mobile and 43 on desktop, so all those optimizations did pay off. Lets open Performance tab and record a page load:
980ms without optimizations, and ca 170ms with optimizations. It also feels faster, which is the important part:
All optimizations would be in vain if the user wouln't notice.
Written by Johan Zetterberg Oct 24, 2017.